g_mmpbsa
MM/PBSA method for GROMACS.
This project is maintained by RashmiKumari
This is now deprecated. Latest version of g_mmpbsa is now HERE.
Contribution of residues to the binding energy
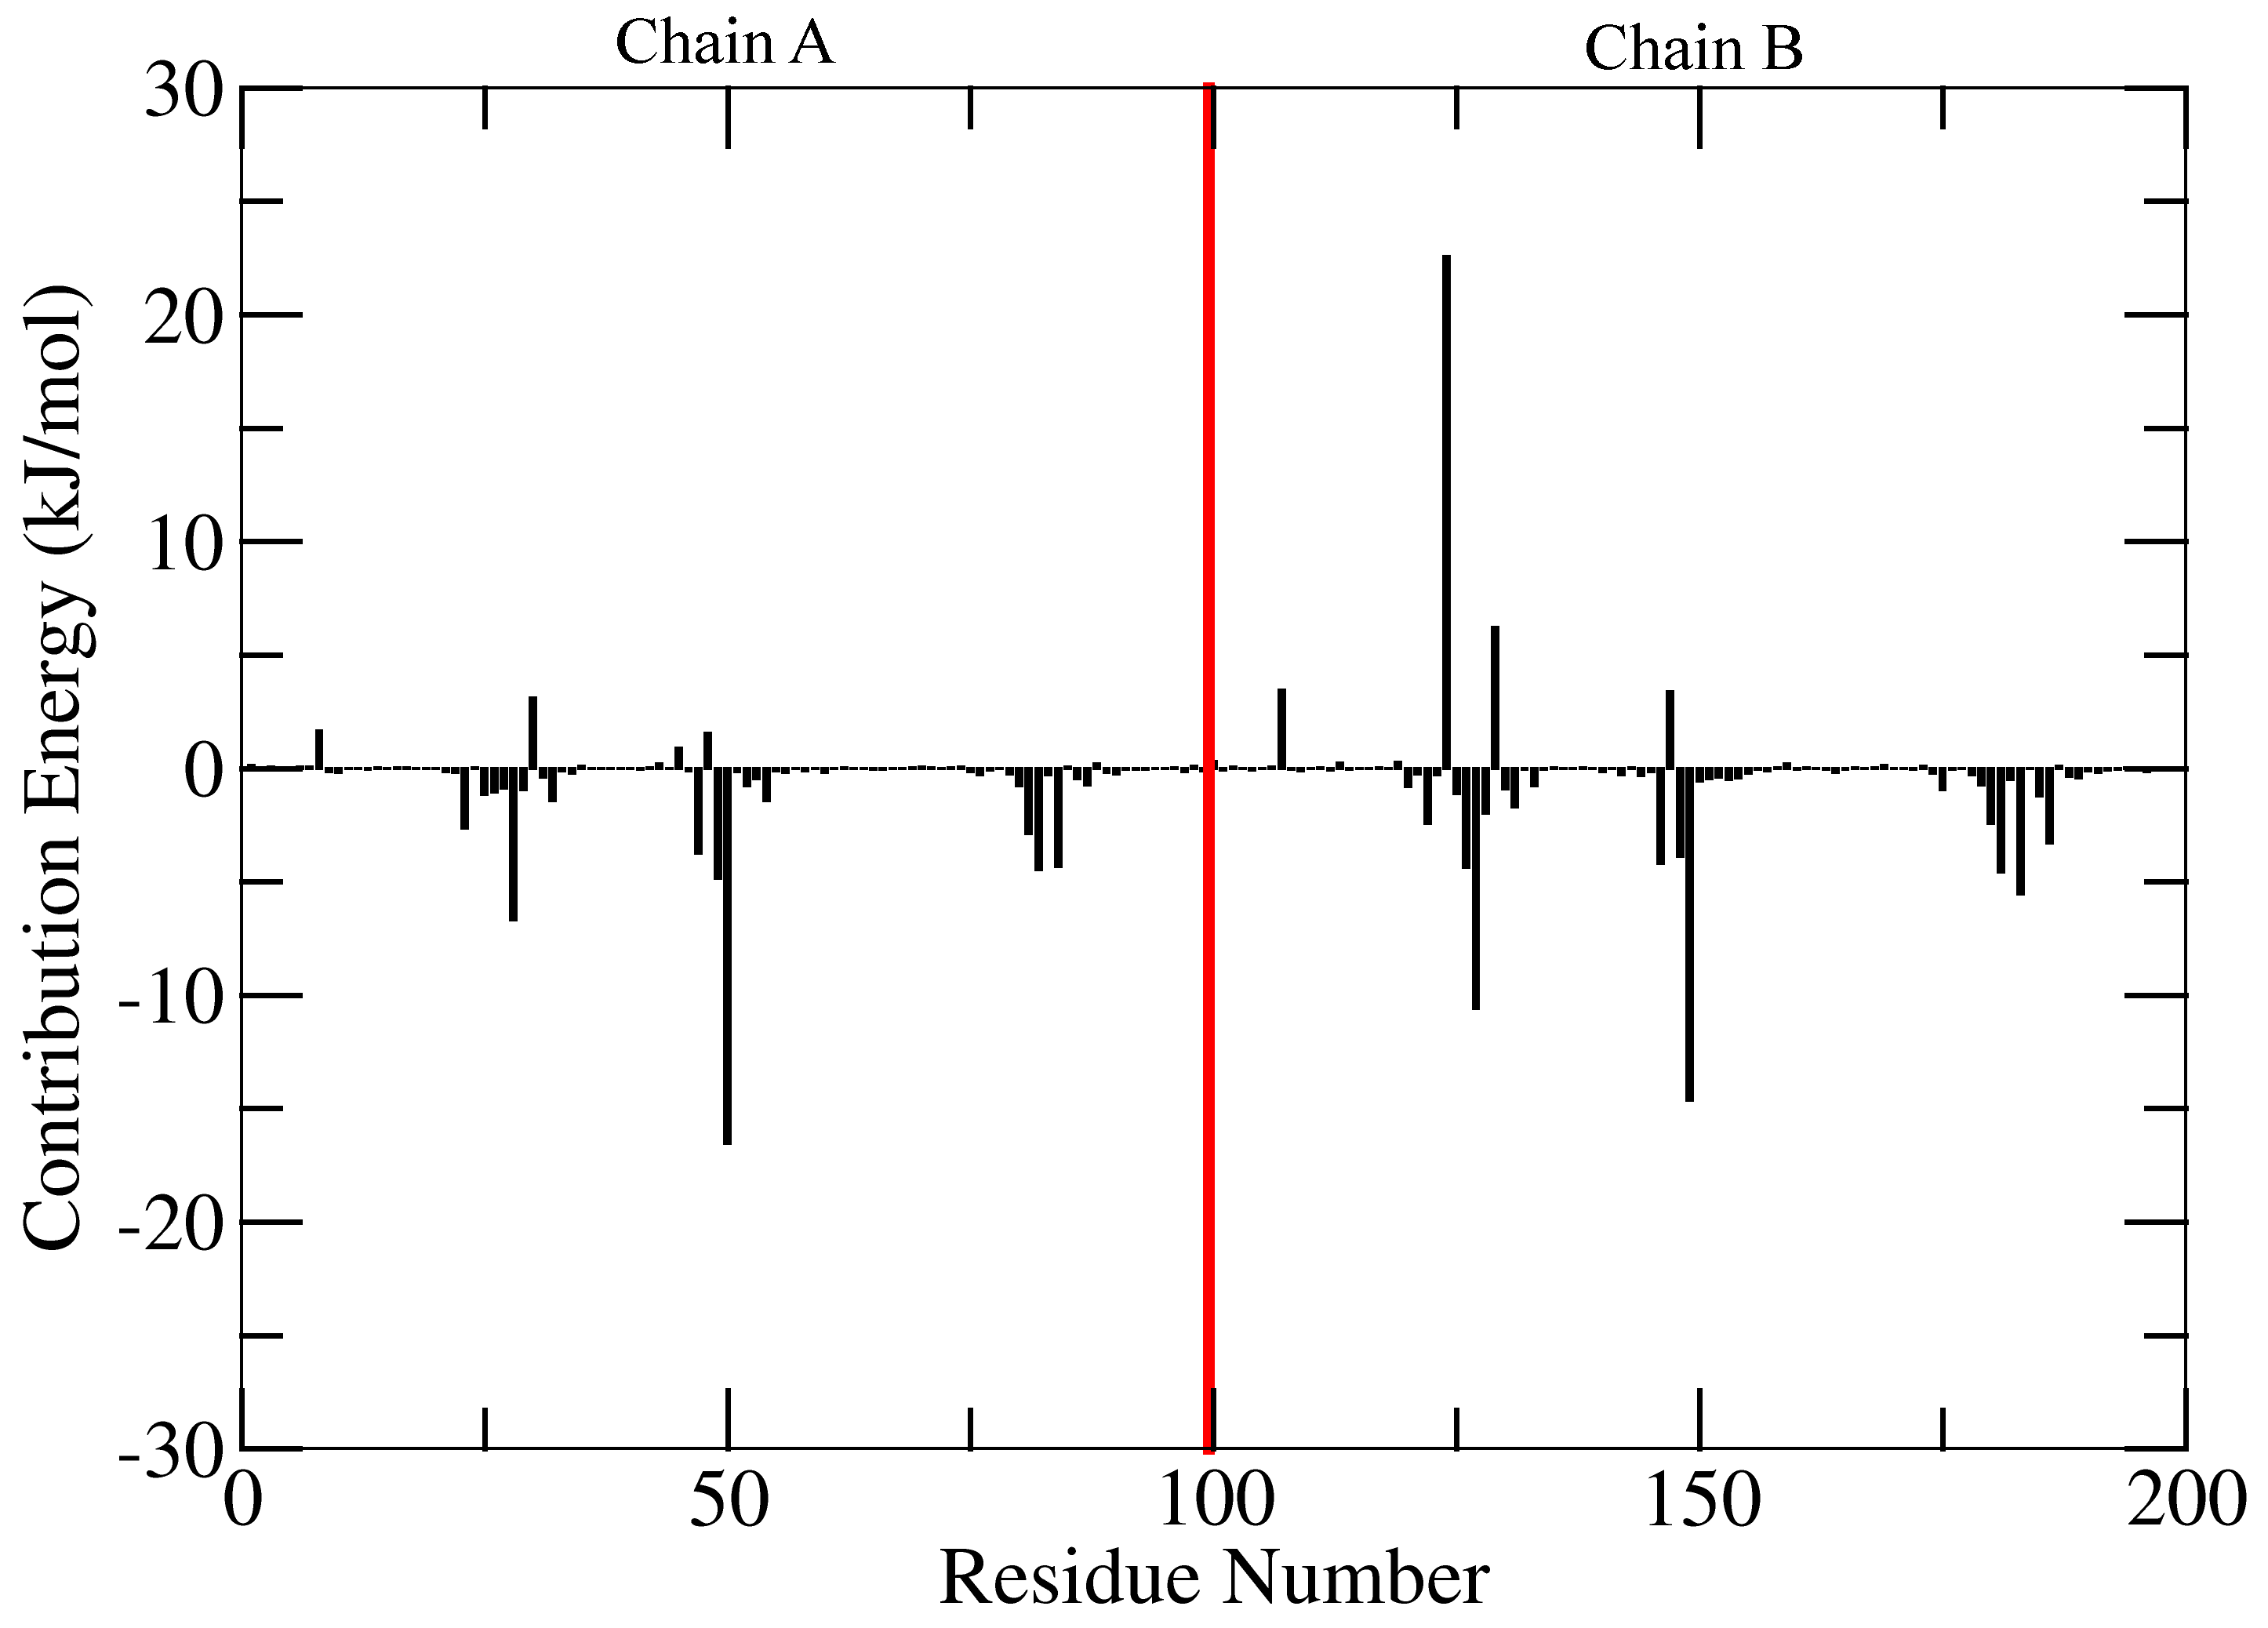
This tutorial is continuation of a previous tutorial. The required input files for this tutorial were generated in previous one.To calculate average contribution of the residues to the binding energy, a python script MmPbSaDecomp.py is provided. For details about this script, please click on this link.
python MmPbSaDecomp.py -bs -nbs 2000 -m contrib_MM.dat -p contrib_pol.dat -a contrib_apol.dat
Two files final_contrib_energy.dat and energyMapIn.dat are obtained after executing the above command. final_contrib_energy.dat contains average with standard error (without bootstrap: standard deviation) values of the energy of contribution to all three energetic terms including binding energy for each residues. The contribution energy of residues could be plotted using file energyMapIn.dat with xmgrace/matplotlib/gnuplot, although value of last residue (inhibitor) should be removed during plotting. For example, a xmgrace format file is provided in tutorial/1EBZ/output.
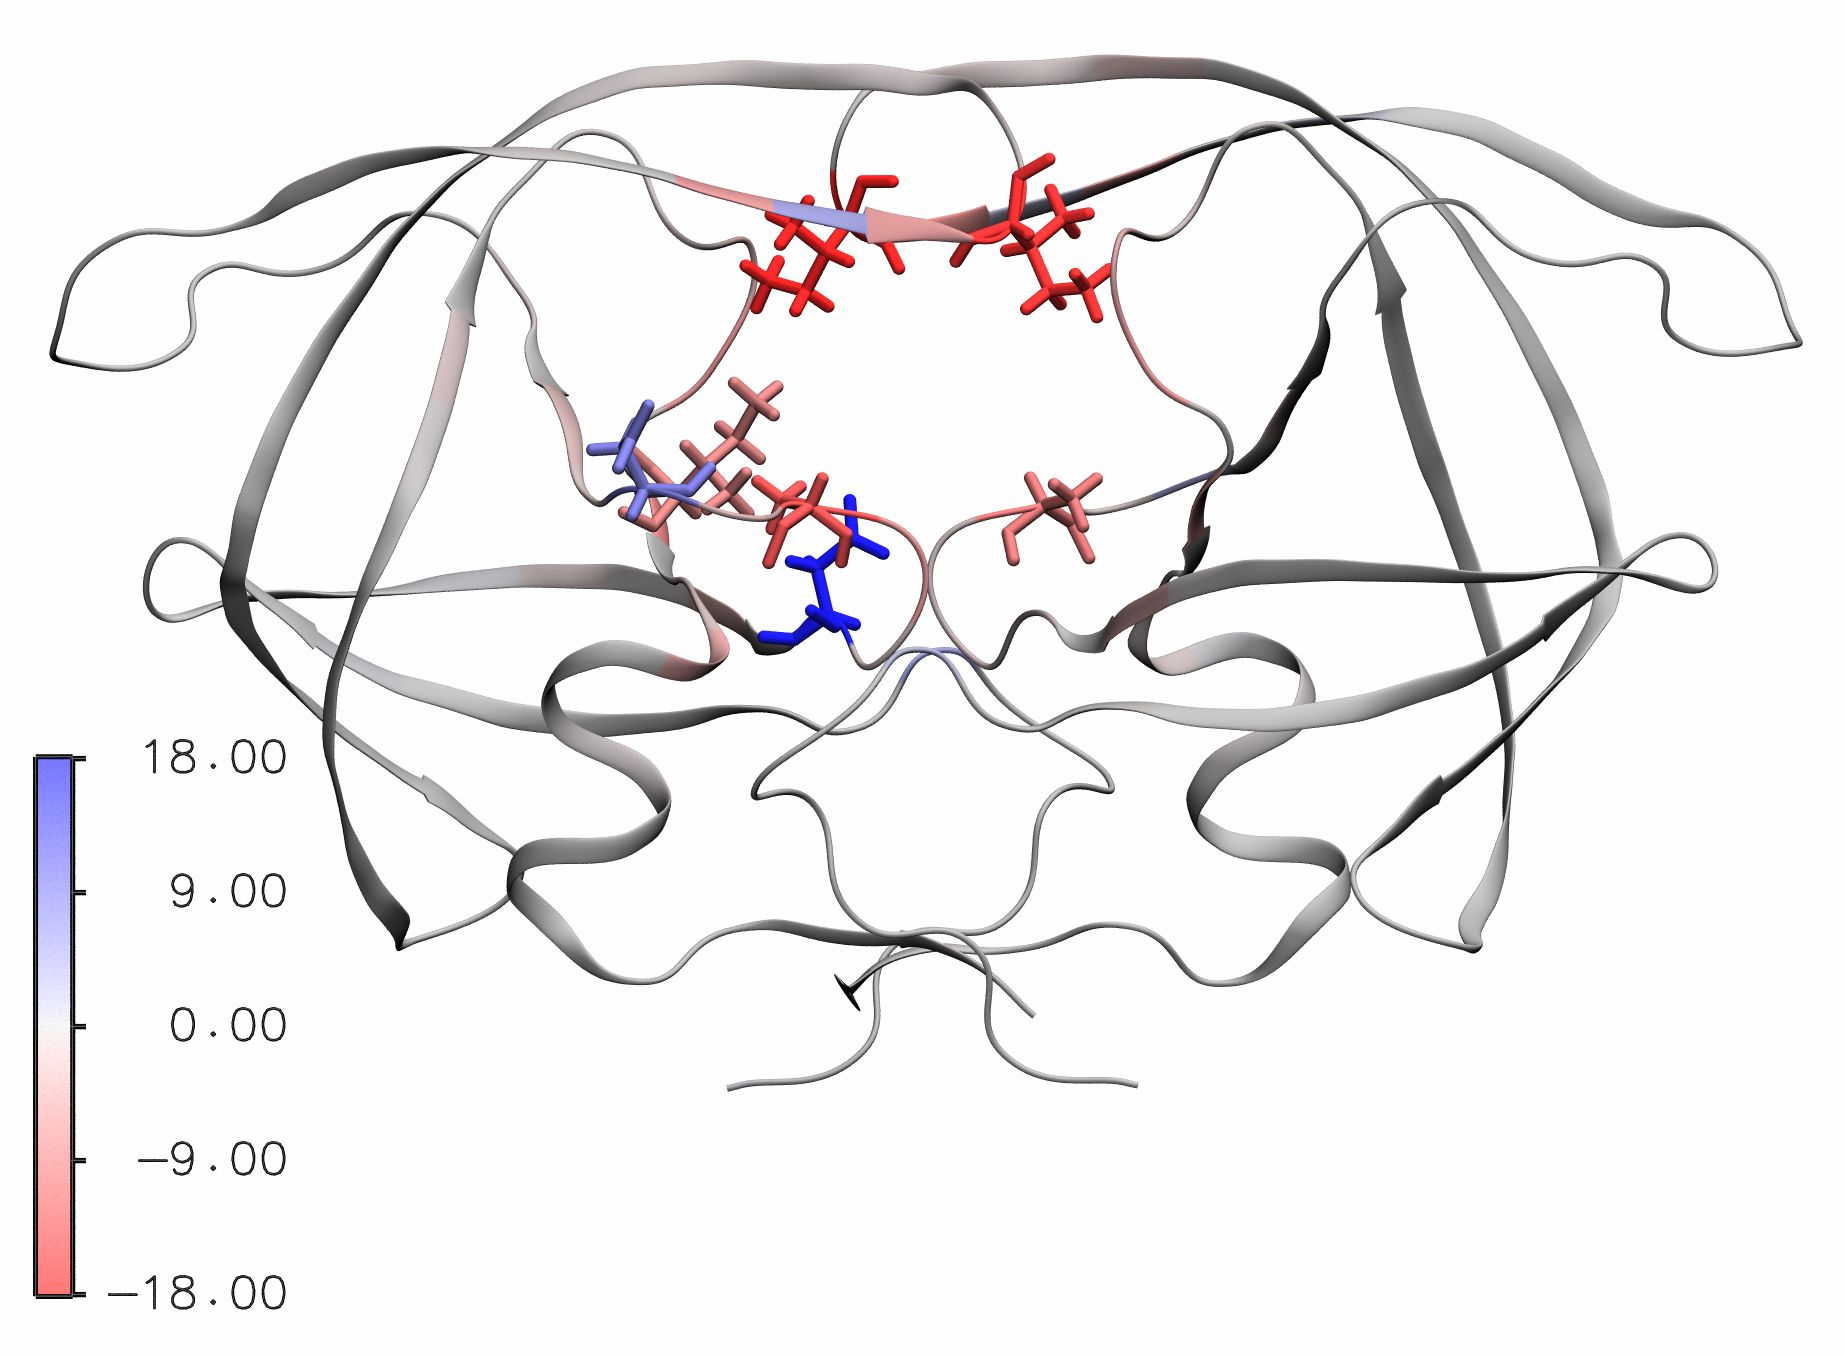
Visualization of contribution energy in VMD
To visualize the contribution energy of residue with its structure, a PDB file containing energy values in B-factor field is required. This file could be generated using energy2bfac.
Execute energy2bfac as following, select 1 and 13 group number for protein and ligand, respectively:
energy2bfac -s 1EBZ_pbc_corrected.tpr -i energyMapIn.dat
Three files complex.pdb, subunit_1.pdb and subunit_2.pdb are obtained with default names. subunit_1.pdb and subunit_2.pdb are the PDB structure file for first and second group number, respectively. Now, load the PDB file in the VMD as follows:
vmd subunit_1.pdb
Change graphical representation to NewCartoon in Drawing Method. Change Coloring Method to Beta. To get a color scale bar, go to Extension ⇒ Visulaization ⇒ Color Scale Bar. Choose Autoscale: On. Chose Label format: Decimal. Then, click on Color Scale Bar.
One could visualize the protein as shown in following figure in which residues with energy < -5.0 and energy > 5.0 are shown in licorice representation. This visualization state could be loaded in VMD as file is provided in tutorial/1EBZ/output/contribution_energy.vmd. Previously obtained subunit_1.pdb file should be present in the current directory. Open VMD, click on File ⇒ Load Visualization State … and open the provided contribution_energy.vmd file.